
ThinkSys Inc · Team of 6
CloudForestX
A cloud cost management platform across 200+ enterprise AWS accounts, with cost visualization, idle resource detection and rightsizing recommendations.
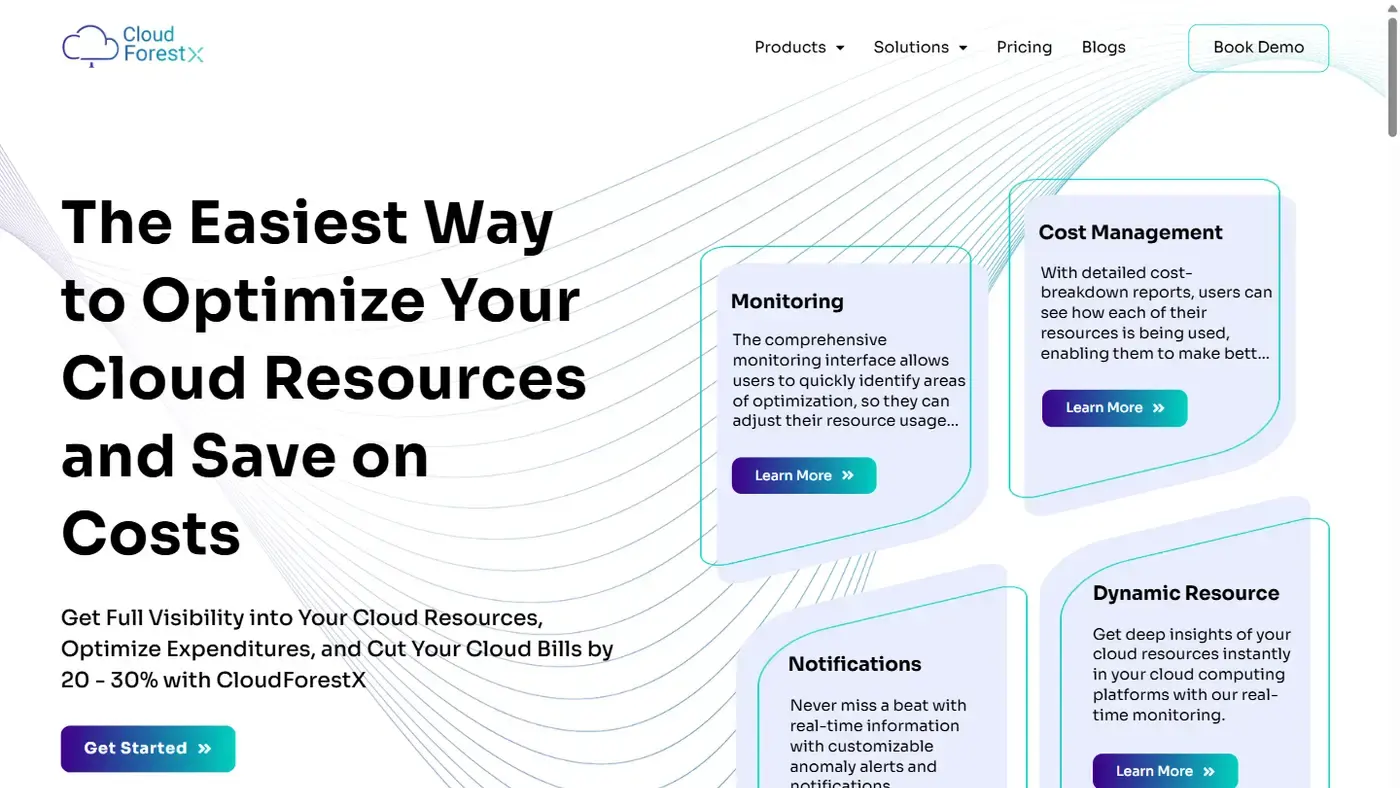
cloudforestx.com · the public marketing site · the platform sits behind a login
At a glance
- 200+ AWS accounts
- 40 dashboards
- 36 API service modules
Scope
Full-stack engineer. The React and TypeScript platform, and the Node.js and PostgreSQL APIs feeding it.
What I built
- Built the React and TypeScript platform behind 40 cost dashboards spanning waste detection, rightsizing, reservations and power scheduling.
- Built the Node.js ingestion service pulling EC2, EBS, S3 and CloudWatch data through STS cross-account roles across 200+ AWS accounts.
- Modeled the ingested cost data in PostgreSQL with Sequelize and served it to the dashboards through Express REST endpoints.
- Developed the data-visualization layer — charts, gauges and geo maps — on ECharts and Recharts behind one reusable chart hook.
- Built a typed API layer and a generic fetch hook with request-id guards, eliminating stale-response races across 36 service modules.
Constraints and trade-offs
Filter state went global in Redux Toolkit rather than living on each page. Forty dashboards read the same account and month selection, so page-local state meant forty places to keep in sync and a filter that silently reset on navigation. The cost is boilerplate on every slice, paid once, for one source of truth.
Overlapping requests are resolved with a request-id guard rather than cancellation. Changing a filter fires several fetches and the slowest can land last, painting a chart with the wrong month. Each call takes a sequence number and only the newest result is allowed to write. It is a few lines instead of an abort-controller layer, and it cannot leave stale data on screen.
Context
Enterprises running hundreds of AWS accounts cannot tell you what any of it costs, or which of it is doing nothing. The platform answers both questions, then recommends what to resize.
This is the engagement where I worked both ends. The ingestion path that pulls hundreds of AWS accounts into something a chart can consume was mine, which meant the API shape and the render budget were designed against each other rather than negotiated across a team boundary.
Stack
- Worked in
- React
- TypeScript
- Redux Toolkit
- ECharts
- Recharts
- Material UI
- Socket.IO
- Node.js
- Express
- PostgreSQL
- Sequelize
- REST
- Integrated
- AWS